
Jump to Week:
1 |
2 |
3 |
4 |
5 |
6 |
7 |
8 |
9 |
10 |
11 |
12 |
13 |
14 |
15 |
16 |
17 |
18 |
19 |
20 |
21 |
22 |
23 |
24 |
25 |
26 |
27 |
28 |
29 |
30 |
31 |
32 |
33 |
34 |
35 |
36 |
37 |
38 |
39 |
40 |
41 |
42 |
43 |
44 |
45 |
46 |
47 |
48 |
49 |
50 |
51 |
52
Note: All data presented for informational purposes only. BroadwayWorld.com makes no guarantees as to the accuracy of the data, or the matter in which it's presented. Source: The Broadway League..
| YEAR | Total Gross | Avg. Gross | Average Ticket | Top Ticket | Seats Sold |
Total Seats |
Shows | Perf. | Average % |
| 1996 | $8,343,555 | $347,648 | $41.28 | $75.00 | 185,819 | 70,959 | 24 | 177 | 27.08% |
| 1997 | $10,449,550 | $360,329 | $42.88 | $75.00 | 225,565 | 256,405 | 29 | 217 | 86.31% |
| 1998 | $12,165,339 | $392,430 | $45.96 | $75.00 | 250,734 | 298,656 | 31 | 242 | 82.87% |
| 1999 | $11,825,871 | $422,353 | $48.29 | $85.00 | 234,667 | 281,708 | 28 | 222 | 82.35% |
| 2000 | $13,758,373 | $443,818 | $51.16 | $90.00 | 259,124 | 302,077 | 31 | 236 | 84.28% |
| 2001 | $13,550,838 | $437,124 | $51.84 | $91.00 | 250,136 | 302,112 | 31 | 246 | 81.68% |
| 2002 | $14,699,450 | $459,358 | $55.77 | $480.00 | 239,937 | 289,266 | 32 | 240 | 78.27% |
| 2003 | $12,040,776 | $445,955 | $57.30 | $480.00 | 193,852 | 257,919 | 27 | 208 | 73.81% |
| 2004 | $15,646,629 | $558,808 | $60.90 | $480.00 | 240,460 | 277,382 | 28 | 215 | 83.95% |
| 2005 | $18,413,040 | $541,560 | $65.14 | $240.00 | 270,279 | 310,347 | 34 | 254 | 84.76% |
| 2006 | $17,146,095 | $571,536 | $69.07 | $301.25 | 233,061 | 258,459 | 30 | 215 | 88.95% |
| 2007 | $18,881,982 | $609,096 | $71.71 | $351.50 | 253,320 | 302,071 | 31 | 236 | 82.48% |
| 2008 | $21,156,392 | $661,137 | $72.69 | $351.50 | 282,569 | 311,601 | 32 | 249 | 89.73% |
| 2009 | $17,119,943 | $590,343 | $68.23 | $350.00 | 233,218 | 280,365 | 29 | 227 | 80.88% |
| 2010 | $20,739,849 | $609,996 | $76.99 | $350.00 | 255,873 | 346,883 | 34 | 259 | 78.91% |
| 2011 | $22,037,020 | $629,629 | $75.85 | $350.00 | 277,139 | 323,580 | 35 | 255 | 84.86% |
| 2012 | $22,982,444 | $766,081 | $88.83 | $477.00 | 247,811 | 297,276 | 30 | 235 | 83.13% |
| 2013 | $28,531,069 | $951,036 | $96.93 | $477.00 | 269,430 | 288,178 | 30 | 232 | 91.52% |
| 2014 | $29,088,089 | $831,088 | $97.63 | $477.00 | 289,602 | 322,894 | 35 | 266 | 89.29% |
| 2015 | $27,962,548 | $798,930 | $94.28 | $497.00 | 284,016 | 321,428 | 35 | 263 | 88.65% |
| 2016 | $31,485,175 | $926,035 | $101.89 | $477.00 | 291,508 | 322,399 | 34 | 260 | 90.15% |
| 2017 | $32,453,595 | $954,518 | $107.42 | $849.00 | 289,719 | 321,383 | 34 | 260 | 90.00% |
| 2018 | $42,016,689 | $1,200,477 | $131.85 | $850.00 | 319,605 | 335,423 | 35 | 266 | 95.38% |
| 2019 | $36,822,965 | $995,215 | $113.05 | $849.00 | 313,513 | 335,481 | 37 | 281 | 93.59% |
| 2021 | $147,041 | $147,041 | $21.43 | $199.00 | 6,862 | 8,925 | 1 | 7 | 76.90% |
| 2022 | $26,814,466 | $1,117,269 | $129.13 | $697.00 | 200,731 | 224,616 | 24 | 182 | 89.89% |
| 2023 | $32,656,200 | $1,053,426 | $118.04 | $697.00 | 259,758 | 279,118 | 31 | 231 | 92.68% |
| 2024 | $37,095,505 | $1,159,235 | $130.25 | $649.00 | 271,802 | 280,583 | 32 | 230 | 96.60% |
Note: All data presented for informational purposes only. BroadwayWorld.com makes no guarantees as to the accuracy of the data, or the matter in which it's presented. Source: The Broadway League..
Videos
 |
Jelly's Last Jam
Pasadena Playhouse (5/29 - 6/23) | |
 |
FIDDLER ON THE ROOF
Sally Field Performing Arts Center (6/1 - 6/9) | |
 |
space exploration because SPACE EXPLORATION because sPaCe eXpLoRaTiOn!!!
Madnani Theater (6/10 - 6/30)
PHOTOS
VIDEOS
| |
 |
Change The Game
McCadden (6/9 - 6/16) NEW MUSICAL
PHOTOS
VIDEOS
| |
 |
FRIDA-Stroke of Passion- IMMERSIVE
CASA 0101 theater (5/31 - 6/9) LIMITED TICKETS REMAIN
PHOTOS
| |
|
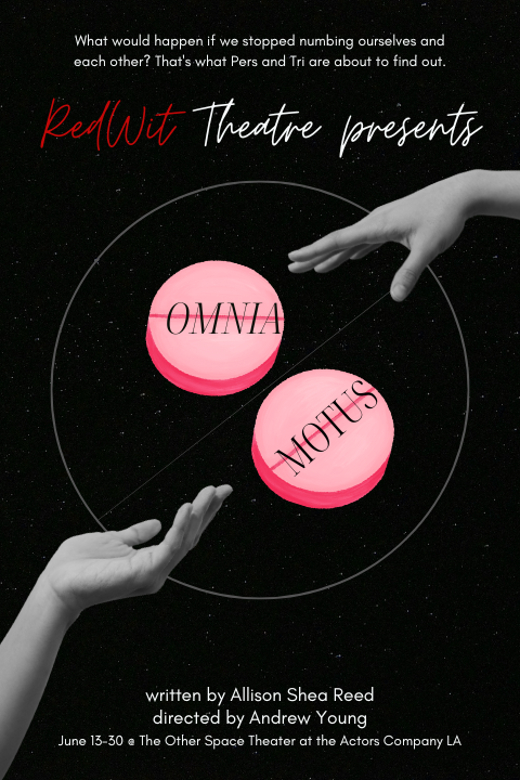
Omnia Motus
The Actors Company LA (6/13 - 6/30) | |
|
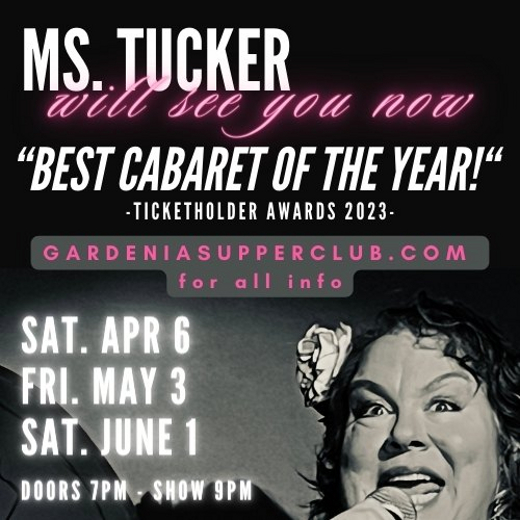
Laural Meade’s Ms. Tucker Will See You Now
Gardenia Supper Club (4/6 - 6/1) | |

|
Darryl Maximilian Robinson Notes 40th Anniversary As Sir Thomas More In Robert Bolt's 'A Man For All Seasons' At UMSL
The Excaliber Shakespeare Company Los Angeles Archival Project (10/1 - 11/30)
PHOTOS
| |
|
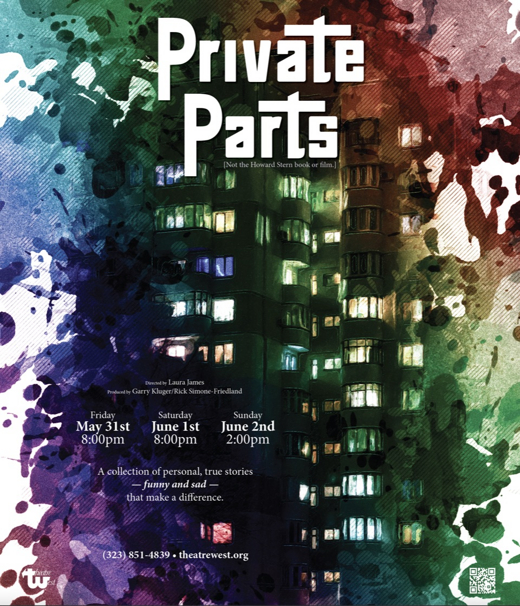
Private Parts
Theatre West (5/31 - 6/2) | |
|
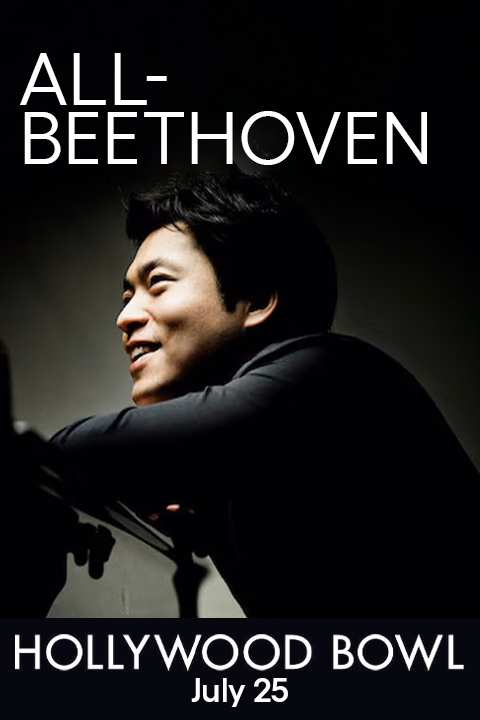
All-Beethoven
Hollywood Bowl (7/25 - 7/25) | |
| VIEW SHOWS ADD A SHOW | ||
Recommended For You
Get Los Angeles's #1 Newsletter
Get the best news & discounts for Los Angeles & beyond.