

Jump to Week:
1 |
2 |
3 |
4 |
5 |
6 |
7 |
8 |
9 |
10 |
11 |
12 |
13 |
14 |
15 |
16 |
17 |
18 |
19 |
20 |
21 |
22 |
23 |
24 |
25 |
26 |
27 |
28 |
29 |
30 |
31 |
32 |
33 |
34 |
35 |
36 |
37 |
38 |
39 |
40 |
41 |
42 |
43 |
44 |
45 |
46 |
47 |
48 |
49 |
50 |
51 |
52
Note: All data presented for informational purposes only. BroadwayWorld.com makes no guarantees as to the accuracy of the data, or the matter in which it's presented. Source: The Broadway League..
| YEAR | Total Gross | Avg. Gross | Average Ticket | Top Ticket | Seats Sold |
Total Seats |
Shows | Perf. | Average % |
| 1996 | $10,834,615 | $416,716 | $46.00 | $75.00 | 215,096 | 258,161 | 26 | 204 | 82.00% |
| 1997 | $11,628,074 | $387,602 | $47.48 | $75.00 | 235,003 | 300,859 | 30 | 239 | 77.13% |
| 1998 | $12,721,324 | $438,666 | $50.53 | $80.00 | 245,103 | 298,985 | 29 | 229 | 81.22% |
| 1999 | $13,862,145 | $420,065 | $51.79 | $125.00 | 254,253 | 325,321 | 33 | 250 | 78.19% |
| 2000 | $14,195,544 | $473,185 | $57.10 | $90.00 | 242,862 | 295,534 | 30 | 233 | 83.07% |
| 2001 | $11,733,506 | $434,574 | $55.19 | $480.00 | 200,392 | 255,900 | 27 | 209 | 78.25% |
| 2002 | $17,153,241 | $504,507 | $61.29 | $480.00 | 262,019 | 337,730 | 34 | 271 | 75.41% |
| 2003 | $16,384,740 | $528,540 | $66.06 | $480.00 | 237,067 | 300,249 | 31 | 247 | 77.30% |
| 2004 | $16,751,477 | $523,484 | $63.69 | $251.25 | 246,981 | 304,812 | 32 | 246 | 79.13% |
| 2005 | $19,029,215 | $634,307 | $72.14 | $301.25 | 250,067 | 303,159 | 30 | 239 | 79.93% |
| 2006 | $21,218,737 | $663,086 | $74.42 | $301.25 | 271,693 | 329,071 | 32 | 257 | 81.44% |
| 2007 | $19,041,972 | $577,029 | $72.51 | $351.50 | 246,524 | 328,494 | 33 | 271 | 68.39% |
| 2008 | $19,744,753 | $617,024 | $78.86 | $350.00 | 238,507 | 312,699 | 32 | 252 | 75.61% |
| 2009 | $20,817,711 | $693,924 | $84.12 | $350.00 | 233,553 | 301,628 | 30 | 240 | 76.86% |
| 2010 | $25,632,217 | $692,763 | $87.41 | $352.00 | 277,015 | 357,102 | 37 | 289 | 76.47% |
| 2011 | $25,004,623 | $757,716 | $92.24 | $477.00 | 258,572 | 326,239 | 33 | 262 | 79.39% |
| 2012 | $23,837,825 | $794,594 | $97.12 | $477.00 | 232,101 | 301,314 | 30 | 239 | 76.62% |
| 2013 | $26,577,883 | $885,929 | $104.78 | $477.00 | 242,849 | 284,484 | 30 | 237 | 84.41% |
| 2014 | $30,085,953 | $835,721 | $106.47 | $475.00 | 273,383 | 343,373 | 36 | 286 | 80.54% |
| 2015 | $29,866,861 | $807,212 | $100.75 | $477.00 | 280,228 | 361,205 | 37 | 292 | 76.78% |
| 2016 | $31,357,490 | $979,922 | $108.09 | $549.00 | 277,699 | 320,496 | 32 | 256 | 87.38% |
| 2017 | $35,260,255 | $1,101,883 | $131.25 | $996.00 | 264,442 | 301,373 | 32 | 251 | 87.96% |
| 2018 | $39,865,469 | $996,637 | $122.02 | $850.00 | 313,917 | 372,089 | 40 | 308 | 84.07% |
| 2019 | $38,869,141 | $1,143,210 | $125.06 | $847.00 | 302,872 | 332,078 | 34 | 267 | 90.55% |
| 2022 | $37,217,001 | $1,063,343 | $118.75 | $599.00 | 283,548 | 324,513 | 35 | 278 | 85.47% |
| 2023 | $30,723,247 | $1,181,663 | $132.02 | $649.00 | 227,099 | 251,470 | 26 | 207 | 90.02% |
Note: All data presented for informational purposes only. BroadwayWorld.com makes no guarantees as to the accuracy of the data, or the matter in which it's presented. Source: The Broadway League..
Videos
 |
FIDDLER ON THE ROOF
Sally Field Performing Arts Center (6/1 - 6/9) | |
 |
What The Constitution Means To Me
International City Theatre (5/2 - 5/19) | |
 |
Change The Game
McCadden (6/9 - 6/16) NEW MUSICAL
PHOTOS
VIDEOS
| |

|
Stalin's Master Class
Odyssey Theatre (4/6 - 5/26) | |
|
Samuel Beckett's Happy Days
ISC Studio (5/16 - 6/8) | |
|
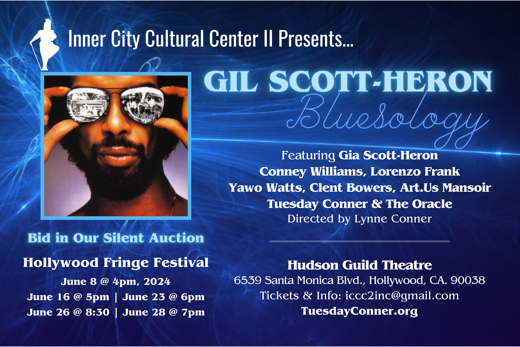
Poets Jazz House Presents Gil Scott-Heron Bluesology
Hudson Guild Theatre (6/8 - 6/28)
VIDEOS
| |
|
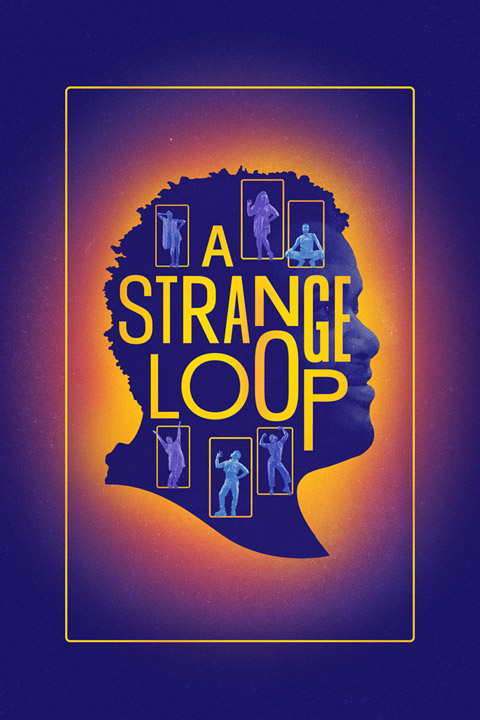
A Strange Loop
Ahmanson Theatre (6/5 - 6/30) | |

|
Velour: A Drag Spectacular
La Jolla Playhouse (8/13 - 9/8) | |
|
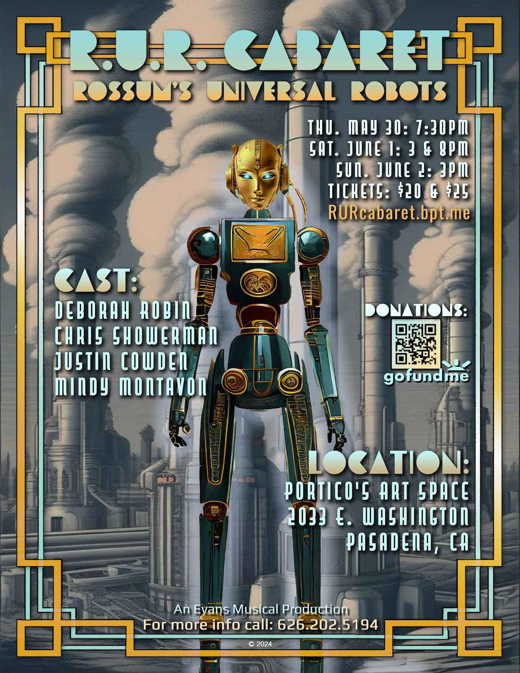
R.U.R. Cabaret
Porticos Arts Space (5/30 - 6/2) | |
|
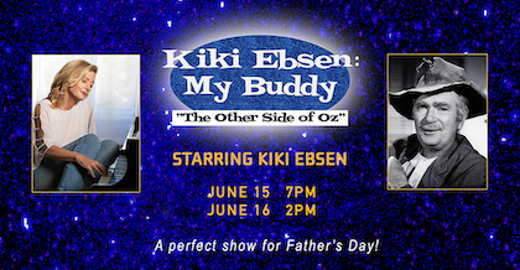
Kiki Ebsen Presents “My Buddy: The Other Side of Oz”
El Portal Theatre (6/15 - 6/16) | |
| VIEW SHOWS ADD A SHOW | ||
Recommended For You
Get Los Angeles's #1 Newsletter
Get the best news & discounts for Los Angeles & beyond.