

Jump to Week:
1 |
2 |
3 |
4 |
5 |
6 |
7 |
8 |
9 |
10 |
11 |
12 |
13 |
14 |
15 |
16 |
17 |
18 |
19 |
20 |
21 |
22 |
23 |
24 |
25 |
26 |
27 |
28 |
29 |
30 |
31 |
32 |
33 |
34 |
35 |
36 |
37 |
38 |
39 |
40 |
41 |
42 |
43 |
44 |
45 |
46 |
47 |
48 |
49 |
50 |
51 |
52
Note: All data presented for informational purposes only. BroadwayWorld.com makes no guarantees as to the accuracy of the data, or the matter in which it's presented. Source: The Broadway League..
| YEAR | Total Gross | Avg. Gross | Average Ticket | Top Ticket | Seats Sold |
Total Seats |
Shows | Perf. | Average % |
| 1996 | $10,895,981 | $403,555 | $45.12 | $75.00 | 219,590 | 263,836 | 27 | 212 | 81.66% |
| 1997 | $11,745,600 | $391,520 | $47.51 | $75.00 | 237,659 | 299,270 | 30 | 238 | 78.78% |
| 1998 | $12,761,152 | $440,040 | $50.51 | $80.00 | 245,895 | 297,213 | 29 | 228 | 81.98% |
| 1999 | $12,925,080 | $403,909 | $53.55 | $125.00 | 234,727 | 313,431 | 32 | 240 | 75.15% |
| 2000 | $12,755,529 | $425,184 | $55.72 | $90.00 | 223,541 | 294,794 | 30 | 232 | 77.37% |
| 2001 | $12,276,747 | $454,694 | $56.73 | $100.00 | 205,517 | 255,900 | 27 | 209 | 80.01% |
| 2002 | $17,591,559 | $517,399 | $61.56 | $480.00 | 266,683 | 333,418 | 34 | 266 | 78.18% |
| 2003 | $16,841,625 | $526,301 | $66.56 | $480.00 | 240,900 | 311,844 | 32 | 253 | 75.51% |
| 2004 | $15,696,860 | $506,350 | $63.70 | $251.25 | 232,388 | 300,375 | 31 | 244 | 76.37% |
| 2005 | $18,052,982 | $564,156 | $69.86 | $301.25 | 243,155 | 312,513 | 32 | 254 | 75.75% |
| 2006 | $19,877,631 | $621,176 | $75.50 | $301.25 | 251,626 | 323,855 | 32 | 252 | 75.92% |
| 2007 | $19,709,595 | $579,694 | $72.87 | $351.50 | 254,081 | 344,686 | 34 | 276 | 71.58% |
| 2008 | $20,376,854 | $636,777 | $80.39 | $350.00 | 243,464 | 311,712 | 32 | 252 | 77.28% |
| 2009 | $22,980,760 | $675,905 | $85.93 | $375.00 | 250,402 | 329,295 | 34 | 270 | 75.60% |
| 2010 | $23,445,874 | $651,274 | $86.73 | $350.00 | 253,436 | 348,912 | 36 | 284 | 71.62% |
| 2011 | $23,795,690 | $721,082 | $92.21 | $477.00 | 245,483 | 326,239 | 33 | 262 | 75.99% |
| 2012 | $22,154,855 | $738,495 | $95.60 | $477.00 | 220,611 | 301,667 | 30 | 239 | 73.70% |
| 2013 | $27,935,666 | $901,151 | $105.45 | $477.00 | 253,429 | 295,806 | 31 | 246 | 85.00% |
| 2014 | $30,147,630 | $837,434 | $106.16 | $475.00 | 275,732 | 343,373 | 36 | 286 | 81.26% |
| 2015 | $29,634,675 | $800,937 | $101.09 | $477.00 | 276,963 | 363,721 | 37 | 294 | 75.02% |
| 2016 | $29,035,904 | $879,876 | $102.96 | $549.00 | 269,437 | 324,880 | 33 | 264 | 83.56% |
| 2017 | $29,983,152 | $999,438 | $115.00 | $996.00 | 242,528 | 287,016 | 30 | 237 | 84.54% |
| 2018 | $40,149,570 | $1,056,568 | $123.87 | $850.00 | 314,249 | 362,566 | 38 | 298 | 85.80% |
| 2019 | $38,317,632 | $1,094,789 | $126.84 | $847.00 | 296,485 | 328,022 | 35 | 271 | 89.73% |
| 2022 | $33,891,293 | $968,323 | $114.47 | $599.00 | 264,069 | 318,349 | 35 | 272 | 80.93% |
| 2023 | $29,568,897 | $1,137,265 | $131.27 | $649.00 | 219,511 | 249,937 | 26 | 206 | 87.71% |
Note: All data presented for informational purposes only. BroadwayWorld.com makes no guarantees as to the accuracy of the data, or the matter in which it's presented. Source: The Broadway League..
Videos
 |
FIDDLER ON THE ROOF
Sally Field Performing Arts Center (6/1 - 6/9) | |
 |
What The Constitution Means To Me
International City Theatre (5/2 - 5/19) | |
 |
Change The Game
McCadden (6/9 - 6/16) NEW MUSICAL
PHOTOS
VIDEOS
| |
|
The Hope Theory
Audrey Skirball Kenis Theater (4/25 - 6/9) | |
|
Jersey Boys
Desert Theatreworks (11/8 - 12/1) | |
|
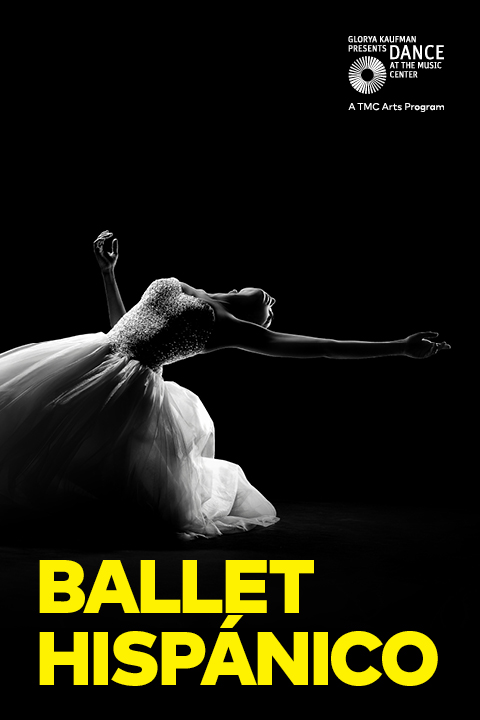
Ballet Hispánico's Doña Perón
Dorothy Chandler Pavilion at the Los Angeles Music Center (7/12 - 7/14) | |
|
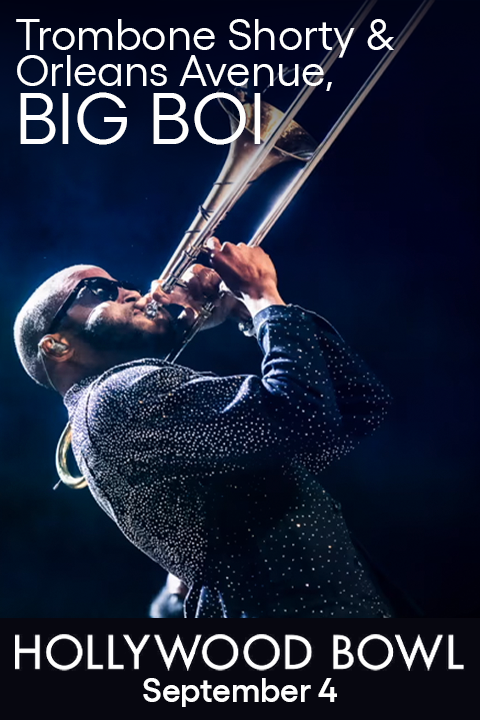
Trombone Shorty & Orleans Avenue, Big Boi
Hollywood Bowl (9/4 - 9/4) | |
|
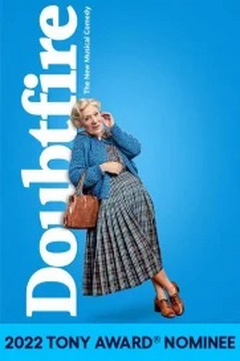
Mrs. Doubtfire
Pantages Theatre (6/11 - 6/30) | |

|
Mt. Joy
Hollywood Bowl (8/25 - 8/25) | |
|
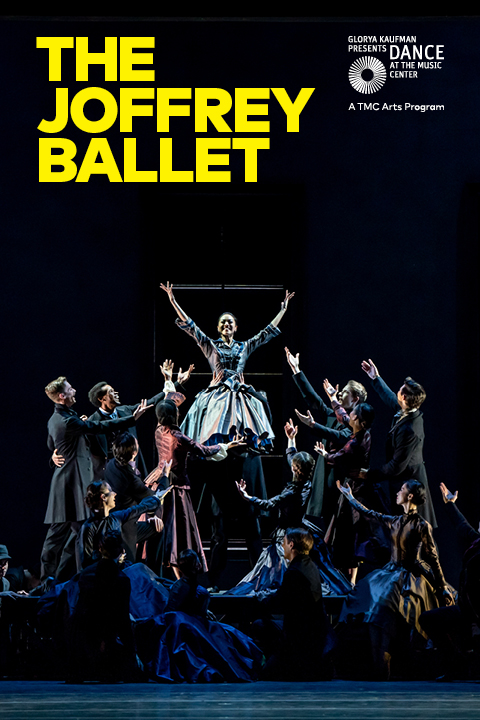
The Joffrey Ballet's Anna Karenina
Dorothy Chandler Pavilion at the Los Angeles Music Center (6/21 - 6/23) | |
| VIEW SHOWS ADD A SHOW | ||
Recommended For You
Get Los Angeles's #1 Newsletter
Get the best news & discounts for Los Angeles & beyond.